 Cyclogram
This is a whole cyclogram built from an empty screen: a four-actuator drilling station with a three-second target. Every step says what to do and why it is done that way, because the "why" is the part that transfers to your own machine.
If you have never drawn a cycle before, you can start here: every idea is built up as it is needed, and nothing below assumes you have read anything else.
The station. A bronze bush is pushed into the drilling position on a slide, clamped, drilled, released, and blown clear by an air jet. One part every three seconds.
The three seconds is not a wish. It comes from demand: the takt the line has to hold, multiplied by the effectiveness the machine will realistically achieve — the companion article has that arithmetic. Here it is the number to beat, and the red line on the chart from the first minute.
Before you open the app. This station needs four lanes, and the free edition edits up to two actuators and six tasks — it will refuse the third lane in Step 3. Every step below still reads, every chart is here, and the finished file at the end opens either way.
The one idea to get right before you draw anything
A bar on a cyclogram is not "this actuator is switched on". It is travel over time.
- The bottom line of the lane is the start position.
- The top of the bar is the end of the travel.
- The rising ramp is the stroke out, the flat body is the time spent at the end position, the falling ramp is the stroke back.
So a clamp cylinder that closes in 0.4 s, holds for 0.8 s and opens in 0.4 s is one bar 1.6 s wide, not three separate bars. Every reader of the chart can then see, at a glance down any vertical line, where each part of the machine physically is.
This is the mistake everyone makes once. Draw on/off bars instead and the chart still looks plausible — but every question you ask it about clearance and overlap will be answered wrong, because the drawing no longer knows where anything is.
Step 1 — Write the sequence down first
Before the app. On paper, in the order a part experiences it:
- The slide carries the bush into position.
- The clamp closes on it.
- The drill feeds down and cuts.
- The clamp opens.
- The slide returns.
- An air jet blows the finished bush clear.
Six lines, four moving parts. Steps 2 and 4 are the same actuator, and so are 1 and 5: that is the difference between a step list and a cyclogram. The list is written per event; the chart is drawn per out-and-back.
Step 2 — Put numbers on it
| Actuator | Stroke out | At the end position | Stroke back | Total |
|---|---|---|---|---|
| Move to position | 0.5 s | 1.5 s | 0.5 s | 2.5 s |
| Clamp | 0.4 s | 0.8 s | 0.4 s | 1.6 s |
| Drill | 0.3 s | 0.5 s | 0.3 s | 1.1 s |
| Eject | 0.2 s | 0.1 s | 0.2 s | 0.5 s |
Where the numbers come from, in order of how much you should trust them: measured on a real machine, then a supplier's stroke-time chart, then a calculation, then a guess. Early on, guesses are fine — the shape of the chart will teach you more than the third decimal place.
The drill's 0.5 s is cutting time from feed rate and depth. The eject's 0.1 s "at the end position" is the air actually blowing; the 0.2 s ramps are the valve opening and closing.
Step 3 — One lane per moving part
In the app, start from an empty project — File → 🗋 New — then Tools → + Actuator, four times. The lanes arrive called Actuator 1…4; click a lane's name in the left column, type the real one, press Enter: Move to position, Clamp, Drill, Eject. While you are in the ribbon, set Target in the Project group to 3 s. A new project starts at 6 s, and that red line is what every chart below is measured against.
Lanes are actuators, not steps. Two reasons, and they both matter later:
- A lane must read as one thing's duty across the whole cycle, so you can see idle time and ask whether that part is earning its place.
- Two bars on one lane at the same instant is a physical impossibility — one actuator cannot be in two places — and the app flags it for you. That check only works if the lane really is one actuator.
Step 4 — Draw the four motions
Switch to ✏ Draw and drag along a lane: press where the motion starts, release where it ends. Only a drag draws — a plain click in Draw mode selects, it never creates — and Draw mode stays on, so you can work lane by lane. Rough is fine: a click on a finished task opens its editor with the time field ready, which is the fastest way to replace a rough drag with the real number. That number is the task's whole span, ramps included.
Then the ramps. Click a task's free edge and that corner becomes a ramp; hovering shows a blue dashed ghost of what you are about to get. A new ramp arrives at a quarter of the task's span. To change its length, drag the inner knee — the joint where the slope meets the flat top. Dragging the outer tip resizes the whole task instead, which is a different job.
A ramp is carved out of the task, not added to it. Put a 0.4 s ramp on a 1.6 s bar and the bar is still 1.6 s wide: the ramp has eaten 0.4 s of the flat top. So set the total span first and carve the ramps out of it. The bar's outer edges do not move when you do, which is exactly what you want while you are still shaping the chart. What moves is the inside — a ramp-up pushes the body's start later within the same bar.
Step 5 — Look at what you have drawn
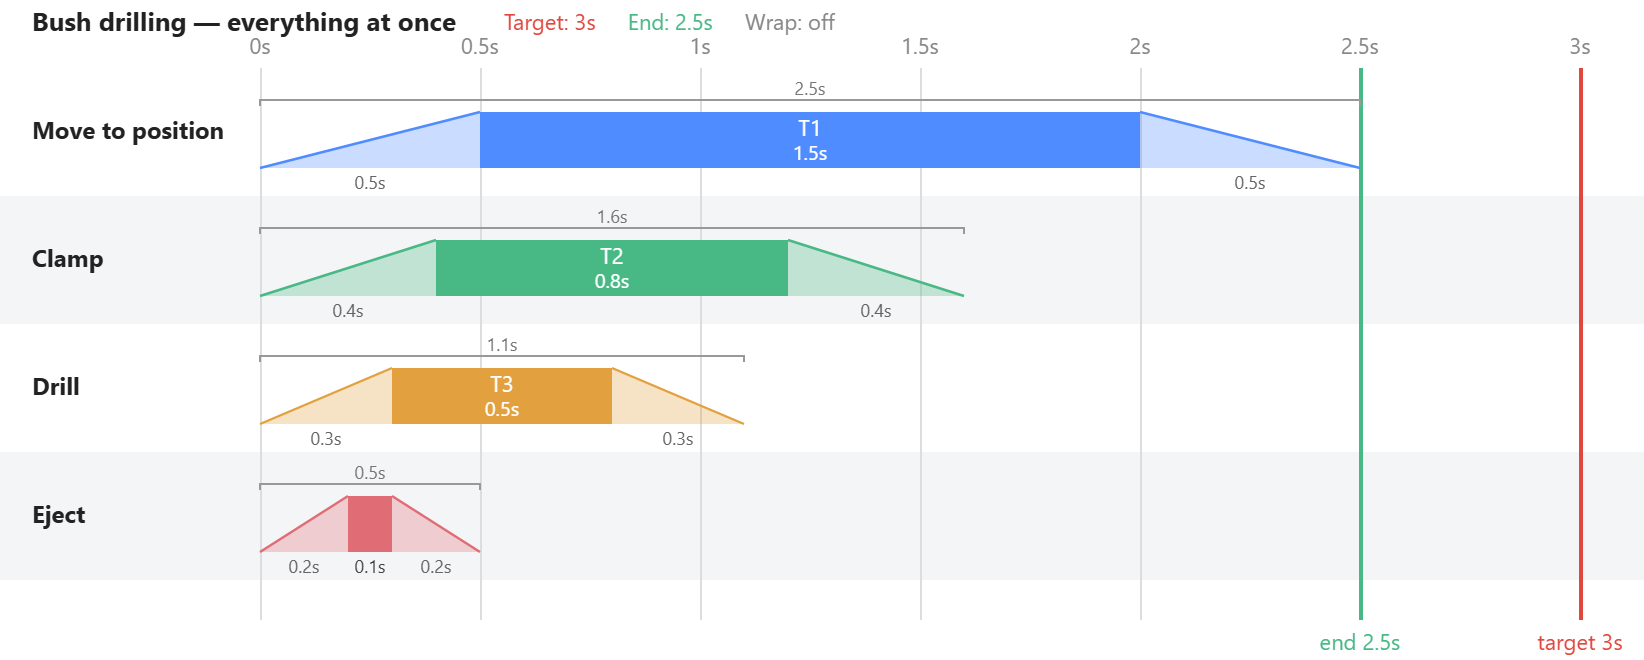
2.5 seconds, and complete nonsense. The drill is cutting at 0.3 s, before the bush has arrived. The air jet fires into an empty fixture and is finished before anything has been drilled.
This picture is worth a moment rather than a skip, because it is half the lesson: the app never invents an order. It draws exactly what you told it, and so far you have told it nothing about what waits for what. Order is something you state.
Step 6 — The other extreme
Leave Draw mode first — ⬚ Select, or Esc — because in Draw mode every drag on a lane makes another new task. Then drag each bar to start where the one before it finished: the sequence exactly as written on paper, nothing overlapping.
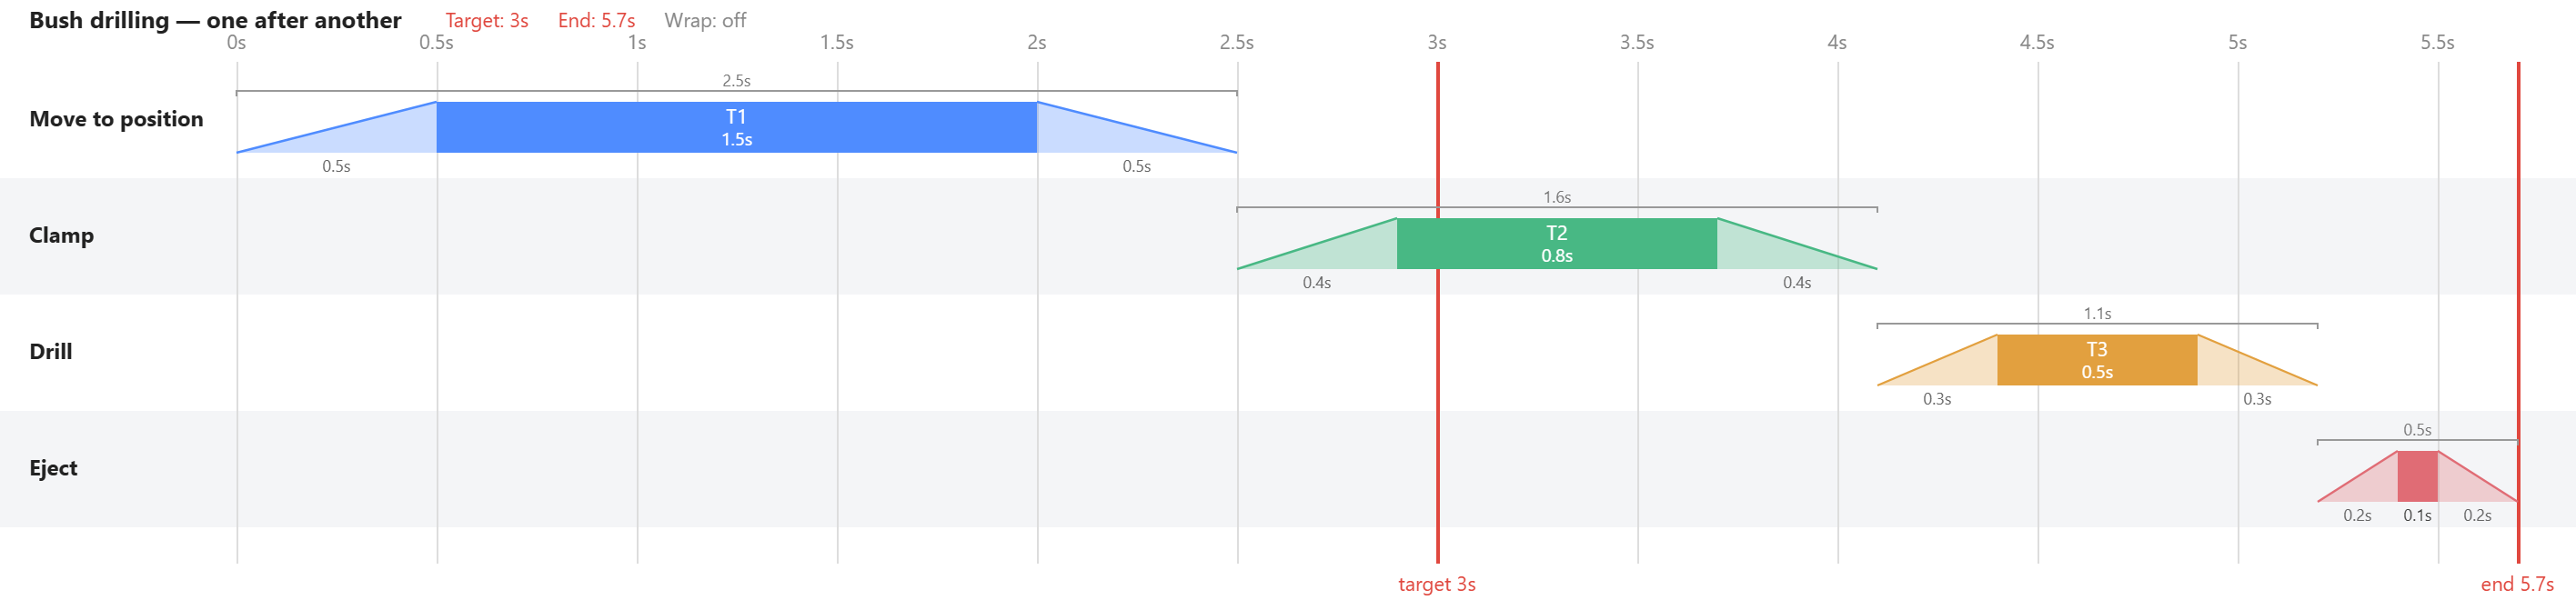
5.7 seconds. Every motion is now in a legal order and nobody would build this machine. The drill is idle for 4.6 of every 5.7 seconds, and the target was three.
Those two pictures bracket the problem. The true cycle is somewhere between 2.5 s (physically impossible) and 5.7 s (correct and wasteful). Every second you are about to find lives in that gap, and finding them means overlapping things that are genuinely independent.
Step 7 — Say what actually waits for what
Back to plain words. Out of those six steps, only three are real dependencies:
- The clamp starts closing when the slide has arrived.
- The drill starts feeding when the clamp is closed.
- The air jet fires when the slide is back home.
Everything else looks free. That short list is the whole of the engineering content you can state in words before you draw — and notice how much of the original step list turned out to be ordering by habit rather than by necessity. It is not the whole truth about this machine, and that is the point: what the words leave out, the drawing shows you. Come back to this sentence at Step 9.
In the app each sentence becomes a binding: drag the small round hook dot on one task's edge onto the hook of the task it waits for. The dot glows when you are near enough to grab it.
| The sentence | Bind this hook | To this one |
|---|---|---|
| The clamp closes when the slide has arrived | Clamp, ramp-up start | Move to position, body start |
| The drill feeds when the clamp is closed | Drill, ramp-up start | Clamp, body start |
| The air jet fires when the slide is home | Eject, ramp-up start | Move to position, ramp-down end |
The hook you pick is the engineering statement, so pick it deliberately:
- "The slide has arrived" is the instant its stroke out ends, which is the start of its body — not the start of the bar, and not the end of it.
- "The clamp is closed" is likewise the start of the clamp's body.
- "The slide is back home" is the very end of its return, the ramp-down end.
Now the order of operations, because one rule governs everything that follows: a binding keeps the picture it finds. At the moment you drop, the app measures the gap the two hooks already have and stores exactly that as the binding's offset. Nothing jumps. Bind straight off the sequential chart of Step 6 and you will record offsets of two seconds and more — three perfectly valid bindings that say "wait two seconds after" — and the cycle will still read 5.7 s.
So move first, then bind. Drag the clamp until its ramp-up start sits on the slide's body start, the drill's onto the clamp's body start, the eject's onto the slide's ramp-down end. Every gap is then zero, so every offset is zero, and the arrangement you made by hand stops being a guess and becomes a model. Bind last, because a bound bar will not drag any more: it tugs, springs back, and its connector pulses red.
Your three new connectors will look bare, and they should: a 0 s offset writes no number on the line, because a zero gap is a pure snap. The exported sheet below prints all three anyway, since a chart on paper has to show a dependency even when the gap is nothing.
An offset is where dead time belongs: valve response, a settle before a cut, a deliberate safety gap. Type 0.05 into the binding rather than nudging the bar 0.05 s to the right — the nudge is right today and wrong the moment the slide gets slower, and the binding is right forever.
Why bind at all, if the bars are already in the right place? Because a picture of one guess has to be redrawn every time a number changes, and a model re-times itself. Step 10 is where that pays.
Step 8 — Read the answer
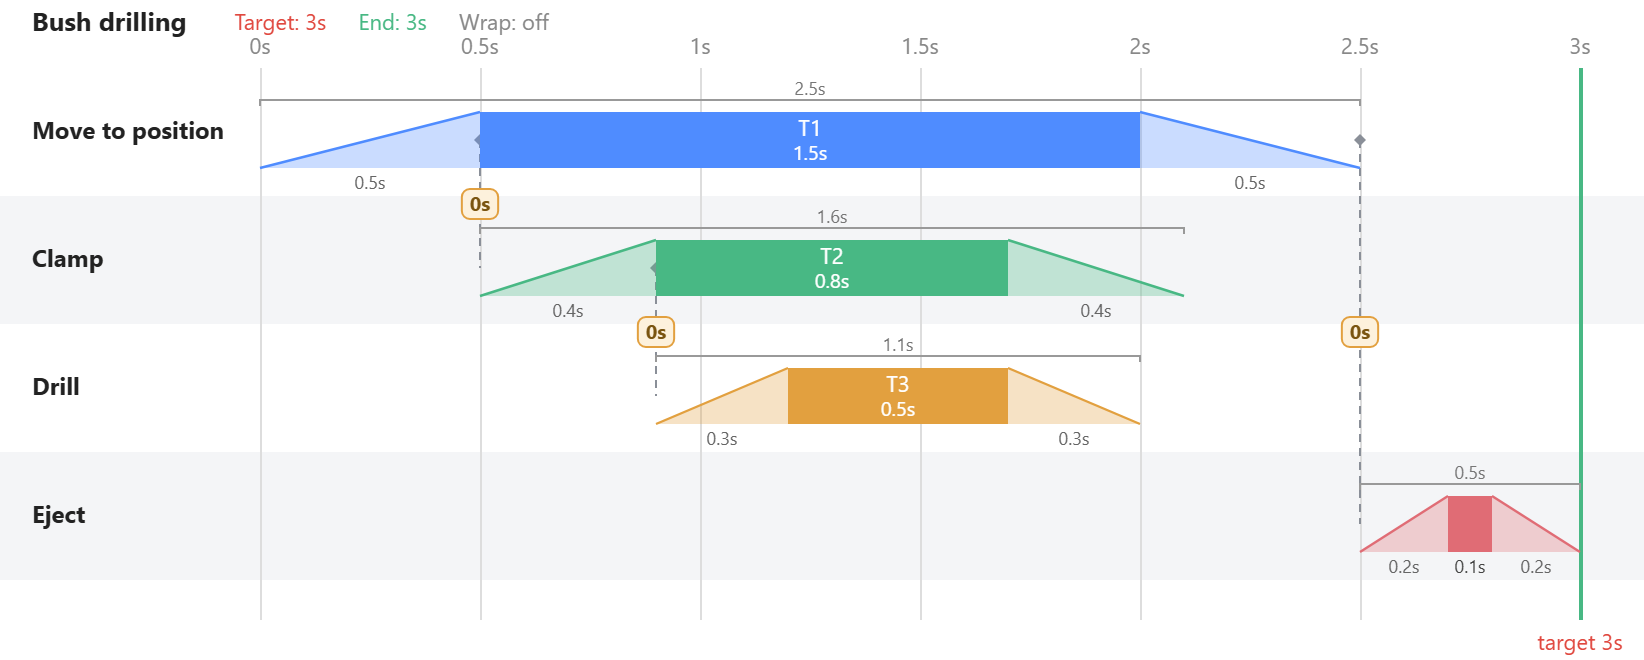
3.00 seconds, exactly on target, from the same four motions that needed 5.7 s in a row.
Look at where the time went. The drill now runs entirely inside the slide's 1.5 s hold, and the clamp almost does — its opening spills a tenth of a second past the end of that hold, which is the first thing Step 9 will ask you about. The hold is time the slide was spending anyway, standing still with the bush in position. Nothing got faster. The overlap was always there; it was not visible until the chart was drawn.
Cycle time is derived, never typed — it is the last ramp-down end in the project, and the app keeps it in the status bar along the bottom. What you type is the target, drawn as the red line. The gap between them is the job. (These exported pictures print both figures in the header; on screen, tick End time in the Project group to draw the end line too.)
Step 9 — Now read it for what the list never said
This is the part that pays for the drawing. Two things are visible in the finished chart that appear nowhere in the six-step list:
The slide starts pulling back at 2.0 s, and the clamp is not fully open until 2.1 s. A tenth of a second where the slide is moving while the clamp is still releasing. Is that a scrapped part, or a non-event because the jaws lose contact well before they reach their end position? Only you can answer that — but you are answering it now, at the drawing stage, instead of discovering it during commissioning.
The drill begins retracting at exactly the moment the clamp begins to open, both at 1.7 s. If the part can shift as the clamp releases while the drill is still engaged, that is a broken drill.
If you decide the slide must wait for the clamp, the fix is not another binding — the clamp already follows the slide, so binding the slide back to the clamp would be circular. Chains have a direction. Instead, extend the slide's hold from 1.5 s to 1.6 s so that its return starts at 2.1 s. The cycle becomes 3.10 s and misses the target by a tenth.
Which is the right outcome: a real decision with a price on it, taken deliberately, months before anyone cuts metal.
Step 10 — Change a number and watch
This is where the binding work pays off. Three experiments, each one made on the finished 3.00 s chart and undone with Ctrl+Z before the next, so every row is that change on its own rather than the three stacked up:
| Change | New cycle | What actually happened |
|---|---|---|
| Drill cuts 0.2 s longer | 3.00 s | Nothing moved. The drill is not on the chain that ends the cycle. |
| Clamp stroke 0.4 s → 0.6 s | 3.00 s | The drill re-timed itself 0.2 s later, all by itself. |
| Slide holds 0.2 s longer | 3.20 s | The eject followed the slide out, and the cycle grew. |
The first two are the useful surprise. Making the drill slower costs nothing at all, because the drill hangs off a chain that ends inside the slide's hold. The cycle length hangs on a different chain: slide → eject. Spend your money there and nowhere else.
That is what a cyclogram is for. Not the picture — the ability to ask "if this gets worse, what does it cost me?" and get a number back instead of an opinion.
But put the first change back on its own, and look at the chart rather than the table. The drill now finishes at 2.2 s, and the slide starts pulling back at 2.0 s: the drill is still in the hole. The cycle time did not change, and the machine just broke. Cycle time is not the only thing the chart is telling you.
Where to go next
- Open the finished file: bush-drilling.mcyc, then File → 📂 Open in the app. Click each dashed connector to see how it is put together.
- The general method, independent of any software: How to draw a cyclogram.
- Then do it to your own machine. The first one takes an afternoon — and an afternoon is usually what it costs to find a second of cycle time that was there all along.