 Cyclogram
A cyclogram is the chart of one repeating machine cycle. Time runs left to right across the page, from the start of the cycle to its end. Every moving part of the machine (every actuator: a cylinder, a slide, a gripper, a servo axis, a conveyor) gets its own horizontal lane. Every movement of that part is a bar on its lane, as long as the movement takes.
That is the whole definition. Everything else is reading it.
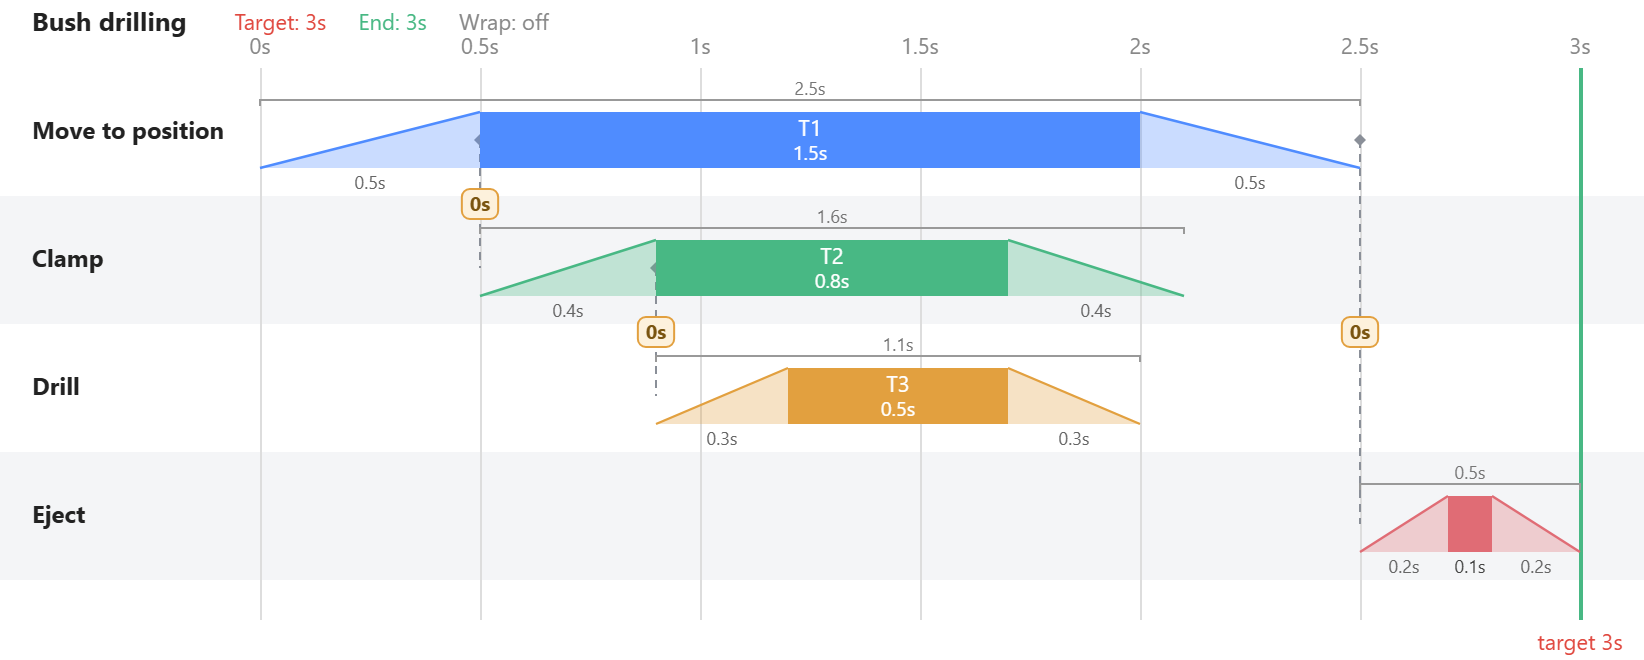
Two ways to read it
Read down a vertical line and you see what the whole machine is doing at that instant: the slide is holding, the clamp is closed, the drill is cutting, the ejector is waiting. That is the view that finds collisions in time, the drill that starts cutting before the part has arrived.
Read along one lane and you see one actuator's whole cycle: when it moves, how long it waits, how much of the cycle it spends doing nothing. That is the view that finds the dead time.
The two together answer the question no sequence list can: not what the machine does, but what each step costs, and what could be happening at the same time. The cycle time is simply where the last bar ends. If that is longer than the takt the line needs, the chart shows which chain of dependent movements sets it, and that chain is where any improvement has to come from.
What a bar is
In a careful cyclogram a movement is not a flat on/off block. A cylinder that closes in 0.4 s, holds for 0.8 s and opens in 0.4 s is one bar 1.6 s wide with three parts: the stroke out, the time at the end position, the stroke back. Drawn as a trapezoid, the bar's height means travel, so the slopes are the strokes and the flat top is the dwell. This matters because most dependencies hang on the inside of a bar: the clamp may close once the slide has arrived (end of its stroke out), not once the slide is back home (end of the whole bar).
Where the word comes from
Cyclogram is a loan from the Russian циклограмма, the standard term in the Soviet and post-Soviet school of automatic-machine design, where the synthesis of the cyclogram is treated as a core design step. Chinese mechanical-design courses teach the same chart as the 工作循环图 (working cycle diagram) in linear, rectangular and circular forms. The circular form belongs to cam-driven machines, where every movement is tied to the angle of one main shaft and the cycle is literally one turn.
English-speaking machine builders more often say timing chart, timing diagram or machine cycle chart; the lean side says cycle chart; German practice has Zyklogramm, Funktionsdiagramm and Weg-Zeit-Diagramm; French has cyclogramme and chronogramme; Spanish ciclograma; Slovenian ciklogram; Japanese サイクル線図 or タイムチャート. They are all the same drawing.
The other cyclograms
The word has unrelated meanings, which is why a search for it can land somewhere odd:
- In biomechanics, a cyclogram (or angle-angle diagram) plots one joint angle against another, for example hip against knee over a walking cycle. It is a loop, not a timeline.
- CycloGraph is a program that plots the gradient profile of a road for cyclists.
- A cyclograph is a drawing instrument for ellipses, and sometimes a camera that records a cyclic motion.
None of those has anything to do with machines. In an automation, packaging, assembly or PLC context, cyclogram means the machine cycle chart on this page.
Step chart or time chart
One distinction is worth settling before you draw anything. A step chart puts equally spaced sequence steps along the bottom and shows order and dependency; it says nothing about duration. A time chart puts real seconds along the bottom, so the width of a bar means something. Both are useful, and pneumatics courses teach both. Only the second can tell you why the machine makes 900 parts an hour instead of 1,200, and a step chart drawn on a time axis is the worst of both, because it looks quantitative and is not. A cyclogram, in the sense used here, is a time chart.
What it is for
- Cycle time, before the machine exists. The end of the last bar is the cycle. Change a stroke, and the number changes with it.
- Overlap. The only way to shorten a cycle without faster actuators is to run independent movements at the same time. The chart shows which movements are genuinely independent and which merely look it.
- Timing collisions. A drill cutting before the part has arrived, a slide retracting while the clamp is still releasing. In the chart these are two bars that touch where they should not.
- Communication. A controls engineer, a mechanical designer and a customer can all read the same chart. A PLC sequence listing, they cannot.
Where to go next
How to draw a cyclogram builds one in six steps and shows how to read it for the seconds that are really available. Drilling a bronze bush, step by step draws the station in the picture above from nothing, in Cyclogram, and turns a 5.7-second sequence into a 3-second cycle. Machine cycle time with overlapping movements is the arithmetic behind that number, by hand. And if you want to draw one now, the editor is free to use and keeps everything in your own browser.